

Executive summary
Thesis: Power and water are one system with two ledgers, yet water is still left out of the plans, sites, reports and scores that every energy decision runs on.
- Generating electricity is the largest use of water in the United States, and moving and treating water is one of the largest energy loads a city carries.
- Artificial intelligence raises the stakes: every new data center adds demand for power and for water at the same time, often where no one has measured the water first.
- Three principles fix the blind spot: set a water baseline before you build, publish water data people can use, and count water in every energy metric.
Key findings
| Figure | What it measures | What it means |
|---|---|---|
| 41% | Share of all U.S. water withdrawals that went to thermoelectric power in 2015: 133 billion gallons per day (USGS Circular 1441). | Power generation is the single largest use of water in the country. |
| About 2% | Share of U.S. energy use that goes to drinking water and wastewater systems; energy can be up to 40% of a drinking water system's operating costs (EPA). | Water is also one of the largest energy loads a community carries. |
| 176 TWh | Electricity used by U.S. data centers in 2023 (Lawrence Berkeley National Laboratory), with an estimated 211 billion gallons of water used to generate that power (EESI). | AI adds demand to both systems at once. |
| 9 MGD → 0.3 MGD | Project Sail, a proposed 910-megawatt data center campus in Coweta County, Georgia: up to 9 million gallons of water a day at full buildout in its January 2025 plans, 300,000 gallons a day in its March 2026 plans (Chattahoochee Riverkeeper). | When a community counts the water, the plan can change. |
One system, two ledgers
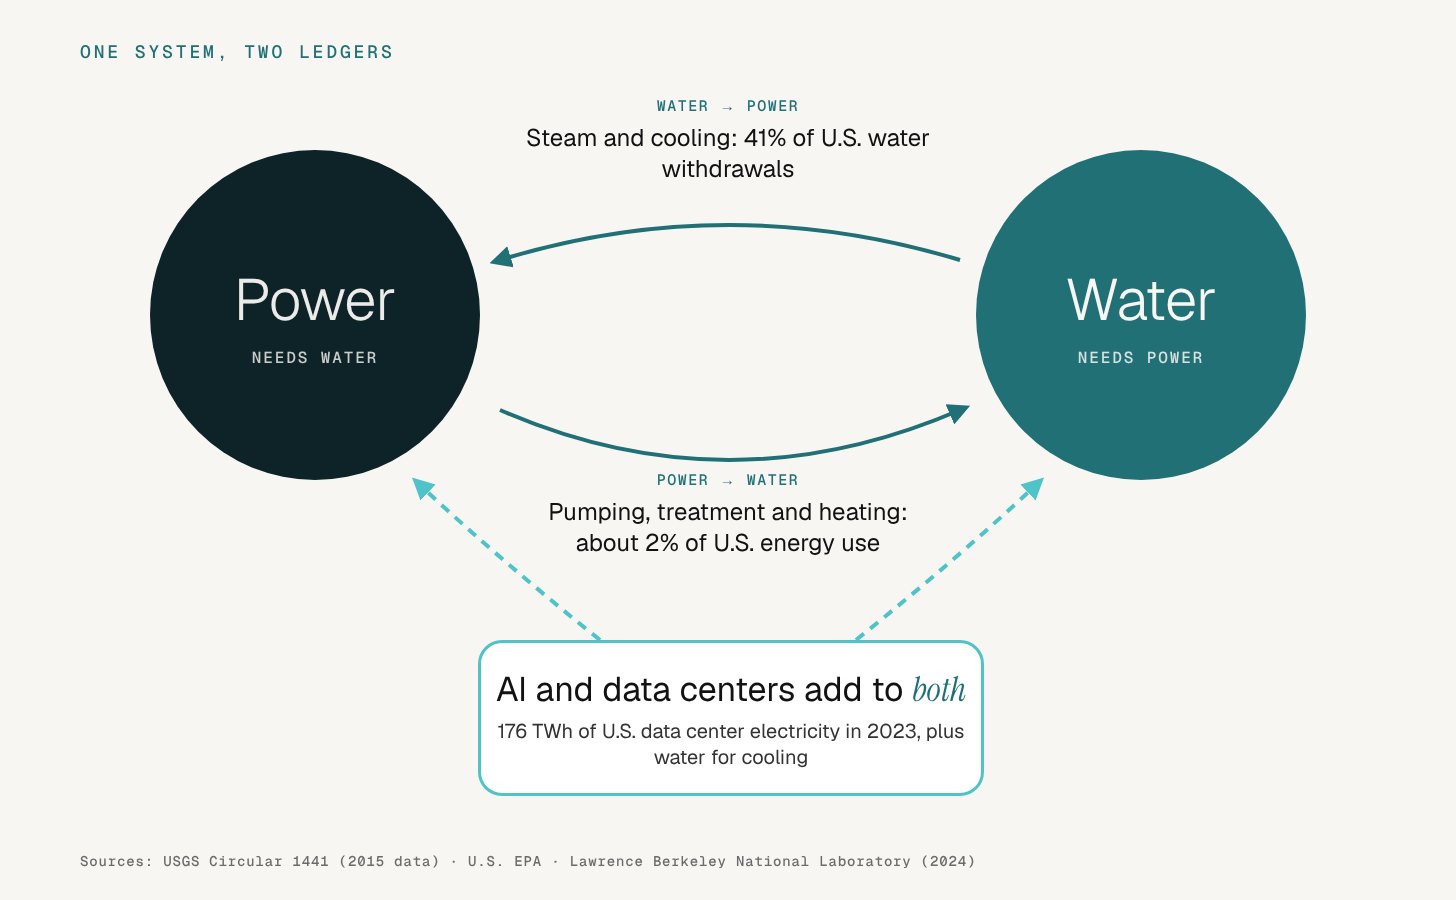
Most electricity in the United States is made by heating water into steam and spinning a turbine, then cooling the equipment with more water. That is why power plants sit on rivers, lakes and coastlines.
The relationship runs the other way, too. Water has to be pumped from rivers and aquifers, treated to drinking standards, pushed through miles of pipe, heated in homes and treated again as wastewater. Every step takes energy.
So when a region adds power, it adds water demand. When a drought lowers a river, it can limit the power plants that depend on it. When a city saves water, it saves energy. The two systems rise and fall together, but they are planned, financed, regulated and reported as if they were separate.
Every energy decision is a water decision. The question is whether we make it on purpose.
Where water gets left out
In the plan. Energy plans forecast megawatts, fuel mix and transmission in detail. The water those megawatts require, and the water quality risks that come with them, often appear as a footnote or not at all.
At the site. Power plants and data centers are sited on grid access, land cost and incentives. Few communities establish a water quality baseline before construction begins, which means no one can later say with confidence what changed.
In the report. A great deal of water information is disclosed. Much of it is not usable. It lives in long technical reports, scattered agency databases and compliance documents that few residents, officials or investors can read. Disclosed is not the same as understood.
In the community score. Communities are increasingly measured by indexes of growth, health, housing and opportunity. Water is often missing from them. Two neighborhoods a few miles apart can be served by different water systems with very different water. A community score that leaves water out cannot see that difference.
Georgia: the proof case
Georgia shows both sides of the nexus in a single state.
The legacy. For decades, coal-fired plants stored coal ash in ponds of water on plant sites. Since 2015, EPA's Coal Combustion Residuals Rule has required utilities to monitor groundwater around these sites and to post the results on publicly accessible websites. Georgia Power announced in 2015 that it would close all 29 of its ash ponds at 11 plants, and it publishes compliance and groundwater documents plant by plant. That is real transparency. The next step is making that record understandable to the people who live nearby.
The frontier. Georgia is attracting a new generation of data center campuses. Project Sail in Coweta County shows what happens when water is counted in public. In January 2025, the campus was planned to use up to 9 million gallons of water a day at full buildout, about one-third of the Chattahoochee River water the county's water authority is authorized to use (Chattahoochee Riverkeeper). After more than a year of public attention to that number, the March 2026 plans call for 300,000 gallons a day, with about 100,000 evaporated in cooling. Each new campus is a chance to do this right from the start: measure first, publish clearly and count water alongside power.
What good looks like
1. Set a water baseline before you build. Before a power plant, data center or major industrial site breaks ground, test the water the surrounding community depends on, and publish the results. A baseline protects residents, and it protects the builder, who can later show what did and did not change.
2. Publish water data people can use. Disclosure should be judged by whether a resident can understand it. That means plain language, maps, the benchmark next to every number and the source and date on every value.
3. Count water in every energy metric. Energy plans, sustainability reports and community scores should report water alongside megawatts and emissions: how much is withdrawn, how much is consumed and what happens to its quality.
Recommendations by audience
| Audience | What to do now |
|---|---|
| Utilities and energy companies | Pair every capacity plan with a water plan. Publish monitoring data in a format residents can read, with maps and benchmarks. |
| Policymakers and regulators | Require pre-construction water baselines for large new energy and data center loads. Set a usability standard for environmental disclosure, not just a posting requirement. |
| Companies and data center developers | Report water withdrawal, consumption and local water quality alongside energy and emissions. Fund independent baselines in the communities where you build. |
| Investors | Ask for water data in every energy and infrastructure diligence process. A site without a water baseline carries a risk no one has priced. |
| Universities | Treat the water-energy nexus as a living lab. Students in data science, engineering, policy and communications can turn the public record into tools people use. |
| Residents | Ask what's in your water before a new plant or data center is approved, and ask who will measure it after. |
Where Aquagenuity® fits
Aquagenuity® is a water intelligence company: the credit score for water quality. The AquaScore™ rates the water that reaches a location from 0 to 100 against the law and the strictest health benchmarks, with every source named. We built it so that water can sit beside every other number a community, company or investor already uses. In metro Atlanta alone, five neighborhoods within roughly 30 miles of one another are served by five different water systems, with published AquaScores™ ranging from 97 to 16 (method 2.1.0).
In Spring 2027, we are bringing this work to university classrooms through Source Code, a data challenge through the lens of water, where students turn public energy and water records into tools their communities can use.
Water connects everything. It belongs in every decision that depends on it.
Methods
How the figures were gathered. Every figure comes from a published public source, read on November 11, 2026. National water and energy figures come from federal agencies and a national laboratory. Georgia figures come from regulatory filings, utility disclosures and the Chattahoochee Riverkeeper's fact sheets, which summarize the developer's filings.
How they were calculated. Aquagenuity® modeled none of these figures except the AquaScores™, which follow the published AquaScore™ method 2.1.0. MGD means millions of gallons per day.
Limits. The 41% figure comes from the most recent national water-use estimate (2015 data). The data center water estimate counts water used to generate the electricity, not on-site cooling, and real use varies widely by cooling design. Project Sail's figures are planned use at full buildout, not measured use, and may change again as the project moves forward. This paper will be updated when newer national data are published.
Sources
- U.S. Geological Survey, Estimated Use of Water in the United States in 2015 (Circular 1441). https://pubs.usgs.gov/publication/cir1441 (accessed November 11, 2026)
- U.S. Environmental Protection Agency, Energy Efficiency for Water Utilities. https://www.epa.gov/sustainable-water-infrastructure/energy-efficiency-water-utilities (accessed November 11, 2026)
- Lawrence Berkeley National Laboratory, 2024 United States Data Center Energy Usage Report. https://eta-publications.lbl.gov/publications/2024-lbnl-data-center-energy-usage-report (accessed November 11, 2026)
- Environmental and Energy Study Institute, Data Centers and Water Consumption (indirect water estimate citing LBNL). https://www.eesi.org/articles/view/data-centers-and-water-consumption (accessed November 11, 2026)
- Chattahoochee Riverkeeper, Coweta County Project Sail Data Center FAQ, January 10, 2025. https://chattahoochee.org/wp-content/uploads/2025/01/Project-Sail-Fact-Sheet-January-2025.pdf (accessed November 11, 2026)
- Chattahoochee Riverkeeper, Project Sail Fact Sheet, March 26, 2026. https://chattahoochee.org/wp-content/uploads/2026/03/Project-Sail-Fact-Sheet-March-2026.pdf (accessed November 11, 2026)
- U.S. EPA, Coal Combustion Residuals Rule, 40 CFR Part 257, including §257.107 (publicly accessible internet site requirements). https://www.law.cornell.edu/cfr/text/40/257.107 (accessed November 11, 2026)
- Georgia Power, CCR Rule Compliance Data. https://georgiapower.com/company/environmental-compliance/ccr-rule-compliance-data.html (accessed November 11, 2026)
- Power Engineering, "Georgia Power to permanently close all 29 of company's ash ponds," October 2015. https://www.power-eng.com/environmental-emissions/georgia-power-to-permanently-close-all-29-of-company-s-ash-ponds/ (accessed November 11, 2026)
- Aquagenuity®, published AquaScores™ and method 2.1.0. https://aquagenuity.com/aquascore/guide (accessed November 11, 2026)